Hey guys.
In uni lab we performed a perkin reaction to for a-phenylcinnamic acids. After separating the E and Z isomers, we dissolved the Z isomer in boiling water for recrystallization. However there was an amount of precipitate that did not dissolve. I held onto this filtrate for IR analysis.
Running IR on all 3 samples, I came out with the following:
e-isomer

z-isomer
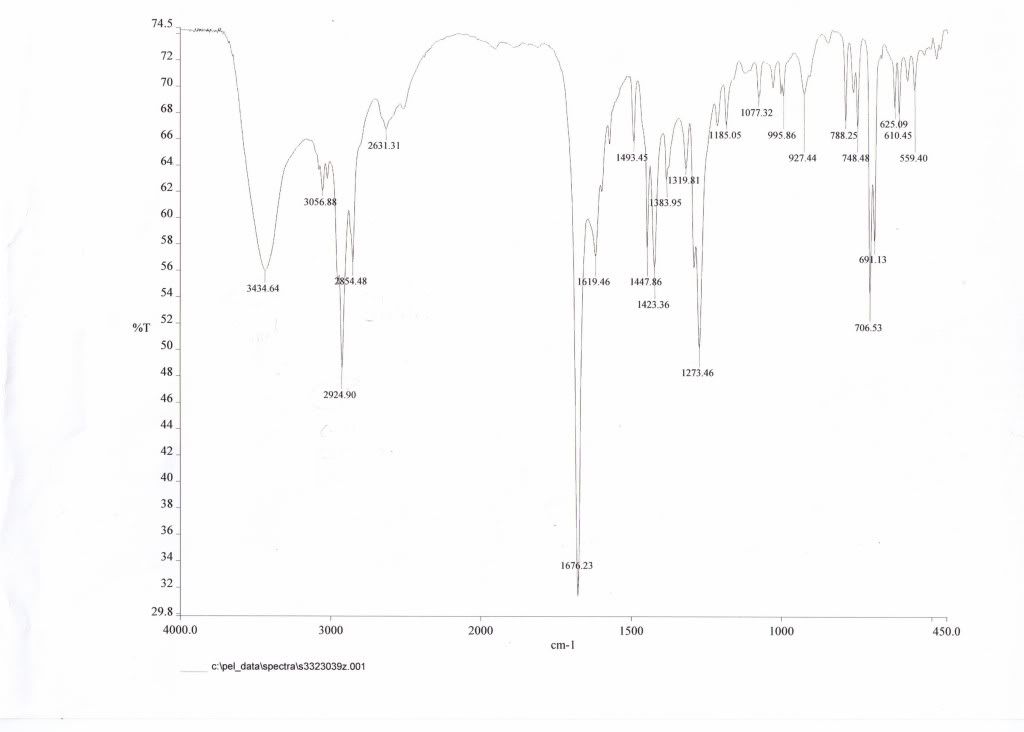
Z-filtrate

First, am I correct in guessing that the "z filtrate" is actually the e-isomer, based on similarities in IR? Mainly due to the absence of the peaks at 2924.90 and 2854.48? But more importantly, I'm guessing these peaks are present in the Z isomer due to the trans configuration. If so, why does the change in conformation create these peaks?
Thanks.
 ChemBuddy |
  Topic: Interpreting IR for E&Z phenylcinnamic isomers (Read 3795 times)